What is a Frequency Table in Math?
We come across a lot of information in the form of numerical figures, tables, graphs, etc., in our day-to-day lives. This information could be about the goals scored in football matches, temperatures of different cities, the most favored items in a class of students, and so on. Data is the information that is collected. Frequency refers to the number of times an event or a value occurs. A frequency table is a table that lists items and shows the number of times the items occur.
Recommended Games


What Is Frequency?
The frequency of a particular data is the number of times the data value occurs. We represent the frequency of a data value by f.
For example, if five students got an A in science, and then the grade A is said to have a frequency of 5.


Frequency Table Definition
A frequency distribution table is a method to organize the data given so that it makes it more meaningful and easier to understand. A frequency distribution table has two or three columns.
- The first column has all the outcomes as individual values or in the form of class intervals.
- The second column of the table includes tally marks of each outcome, which also tells us about the frequency using vertical lines. It is optional.
- The third column tells us about the frequency of each outcome.
For example, Alan has to put some footballs into two boxes. He starts dropping one football after the other into two boxes named A and B. Alan drops the balls randomly, and after dropping 10 balls, he takes some rest and then repeats the task with the remaining 10 balls.
The given tables show the pattern of how Alan drops the footballs in two boxes.


Plotting the frequency of a ball falling in Box A in the case of both the trials in one table, here’s what we get:

Such a table is known as a frequency table. We make the table by arranging the collected data values and their corresponding frequencies. The purpose of constructing this table is to show the number of times a value occurs.
Frequency Tables and Tally Marks
Tally marks help in counting the frequency. It is represented by vertical lines. The tally marks for 1–5 are given below:

In the example given above, if we had to construct a frequency distribution table using tally marks, we would get the frequency chart:

How to Make a Frequency Distribution table?
We can make a frequency distribution table by using the steps given below:
- Step 1: Make a table with two columns—one with the title of the data you are organizing, like grades, scores, temperatures, etc., and the other column for frequency.
- Step 2: Look at the items written in the data and decide whether you want to draw an ungrouped frequency distribution table or a grouped frequency distribution table. If there are many different values, we should go with the grouped frequency distribution table.
- Step 3: Write the data set values in the first column.
- Step 4: Count the number of times each item is repeating itself in the collected data. In other words, we have to find the frequency of each item by counting.
- Step 5: Write the frequency in the second/third column corresponding to each item.
- Step 6: Write the total frequency in the last row of the table.
Frequency Table Example
Below are the scores of 35 students in a science test (out of 10). Arrange these in a tabular form using tally marks: 5, 8, 7, 6, 10, 8, 2, 4, 6, 3, 7, 5, 8, 5, 1, 7, 4, 6, 3, 5, 2, 8, 4, 2, 6, 4, 2, 8, 9, 5, 4, 7, 5, 5, 8.
The table is given below.

Frequency Distribution Table for Grouped Data
A frequency distribution table in which we group the data is known as a grouped frequency distribution table. The table is based on the frequencies of class intervals. All the categories of data are divided into different class intervals of the same width, for example, 0–5, 5–10, 10–15, etc. And then the frequency of that class interval is marked against each interval.
Important points:
- The class intervals are in the form of Lower Limit–Upper Limit. The lower limit is the smallest data value in the class and the upper limit is the highest data value in the class. For example, in the interval 0–5, 0 is the lower limit and 5 is the upper limit.
- The lower limit is included in the class interval but the upper limit can not be included in the class interval. For example: the observation 0 will be included in 0–5 but 5 is not included in the same class interval. Rather it will be used in the class interval 5–10. This method is known as an exclusive method.
For example:

Uses of Frequency Tables in Our Daily Lives
When the data is small, it is easy for us to analyze it. But when the data is big, the frequency table plays a very important role. Here are some uses of frequency tables:
- To organize the grades obtained by the students.
- To organize the goals scored by players in a soccer match.
- To organize weekly expenses of employees.
- To organize the number of customers that visited a particular restaurant.

Solved Examples On Frequency Table
Example 1: An office complex conducted a blood donation camp, where the blood groups of 25 employees were recorded as follows.
A+, B-, O+, O-, AB-, O-, A+, O-, B-, A-, O+, B+, A-, O+, O+, A-, AB-, O-, A+, A-, O+, O-, AB-, B+, A+. Represent this data in the form of a frequency distribution table using the tally marks.
Solution:

Example 2: Complete the following frequency distribution table.

Solution:
The frequency table is shown below:

Example 3: The following are age groups of 20 people in a concert.
5, 65, 62, 48, 5, 23, 17, 40, 32, 34, 35, 51, 6, 18, 52, 28, 39, 41, 20, 69
Construct a grouped distribution table with class intervals 0–10, 10–20 and so on.
Solution: The table would be as shown below:

Practice Problems On Frequency Table
Frequency Table in Math - Definition With Examples
The weekly allowance (in $) of a group of 20 students are given below. 27, 31, 24, 31, 16, 36, 21, 22, 34, 29, 25, 29, 27, 39, 27, 23, 28, 29, 24, 27. Which allowance has the highest frequency?
27 occurs the maximum number of times. Hence, the frequency of 27 is the highest.
What will be the tally mark for 23?


There are 4 sets of 5 tally marks which is equal to 20.
And 3 free tally marks which is equal to 3.
Therefore, $5 + 5 + 5 + 5 + 3 = 23$
Which class interval has the highest frequency?
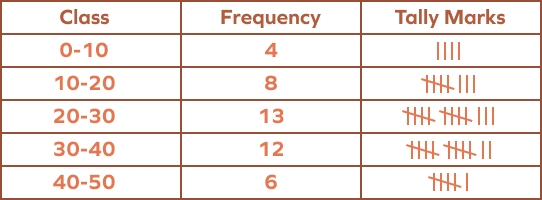
The frequency of 20–30 is 13, which is the highest of all.
Frequently Asked Questions On Frequency Table
What is a tally distribution table?
The table in which we include tally marks and the frequency of data is known as a tally frequency table.
How many types of frequency distribution tables exist?
There are three types of frequency distribution tables:
- Grouped frequency table
- Ungrouped frequency table
- Cumulative frequency distribution table
What is the difference between ungrouped and grouped frequency distribution tables?
A grouped frequency distribution table is a table in which the class intervals and the data are separated into the groups. On the other hand, an ungrouped frequency distribution table is a table in which we do not use the class intervals and show the frequency of an item individually.