What is Multiplication Chart?
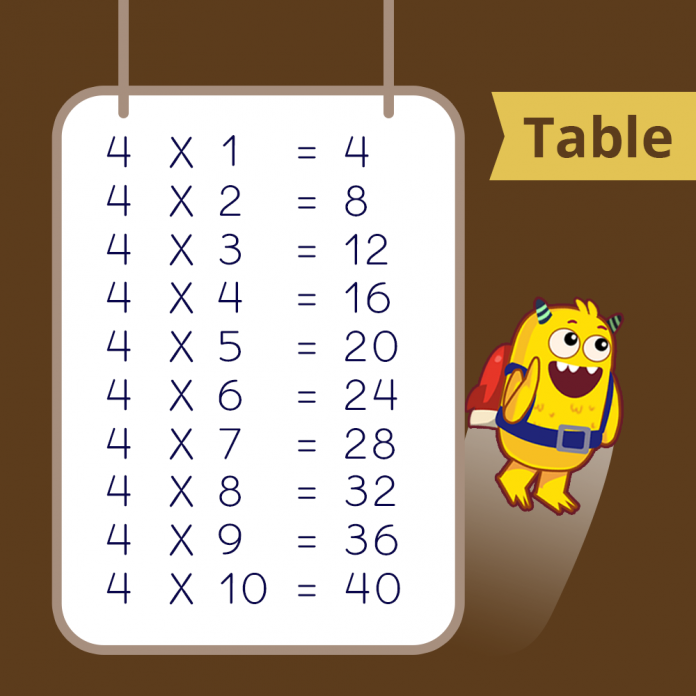
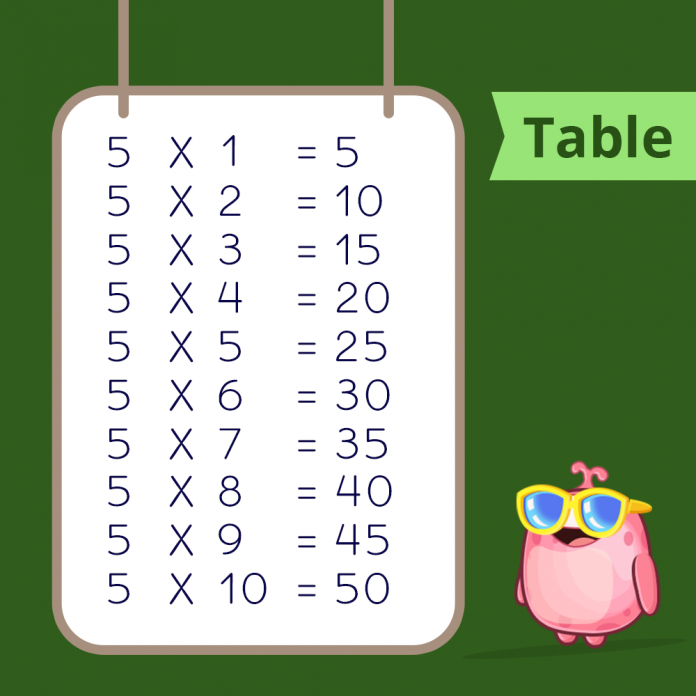
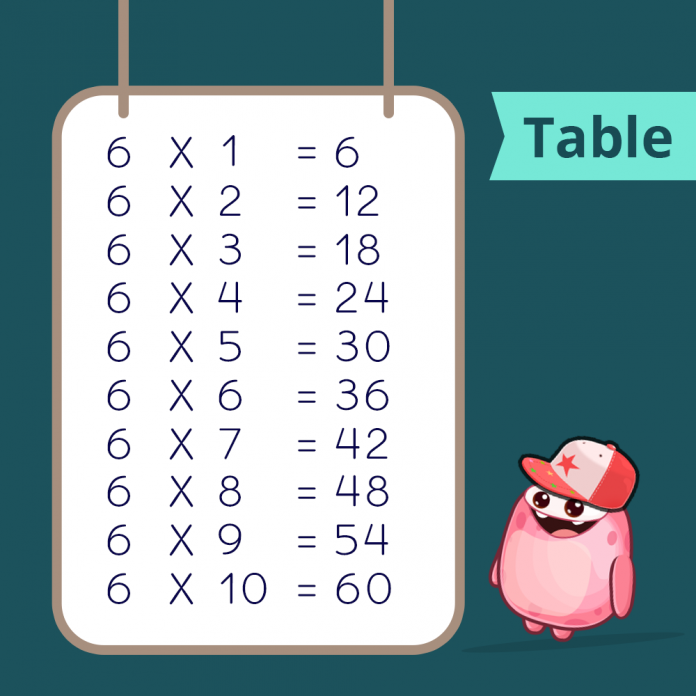
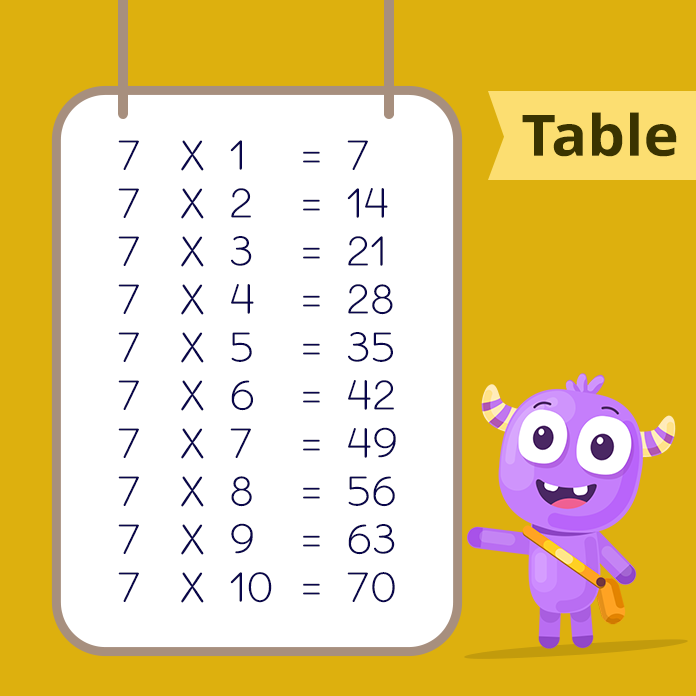
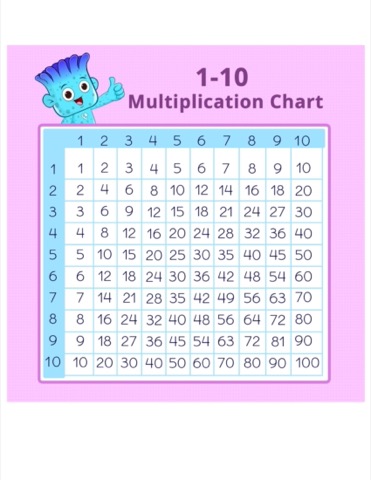
A multiplication chart is a table that shows the products of two numbers. Usually, one set of numbers is written on the left column and another set is written as the top row. The products are listed as a rectangular array of numbers.
Multiplication is repeated addition.

There are 3 groups of 4 butterflies each. That is, the total number of butterflies is 3 times 4 or 4 + 4 + 4 or 12.
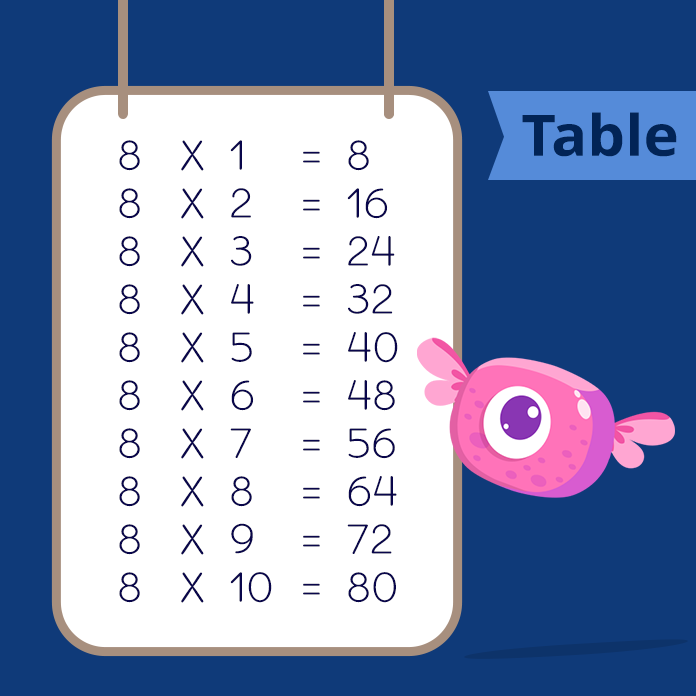
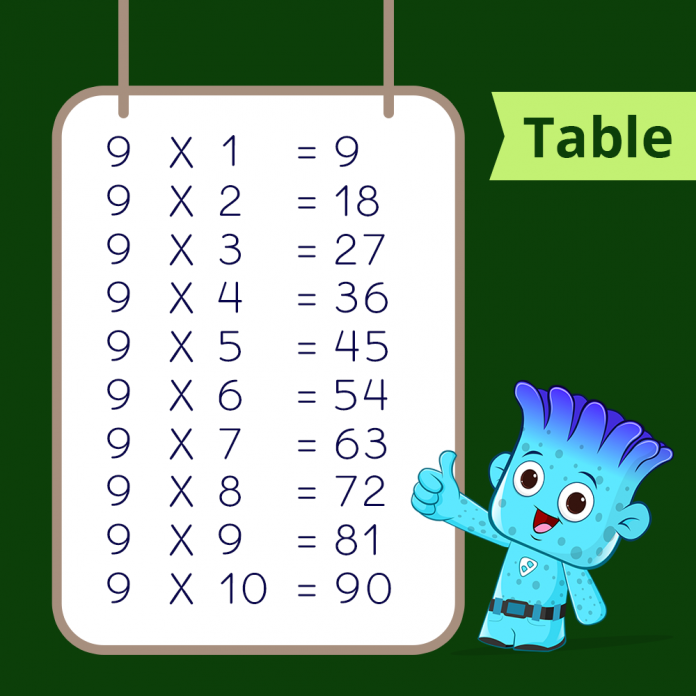
A simple way to do the day-to-day calculations is through the help of a multiplication chart or times table.
A multiplication chart is a table that shows the products of two numbers. Usually, one set of numbers is written on the left column and another set is written as the top row. The products are listed as a rectangular array of numbers.
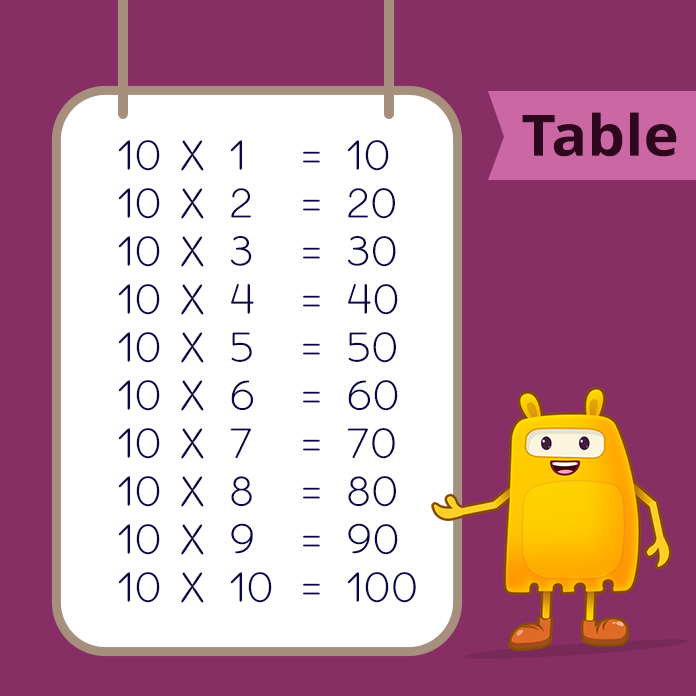
For example, a multiplication chart of 10 can be written as:

Recommended Games
Reading a Multiplication Chart
Step 1: Choose the first number from the numbers listed in the left-most column and the second number from the top-most row.
Step 2: Move the first number along a row and the second number down a column. The square where the two numbers meet gives the product!
For example 5 × 4
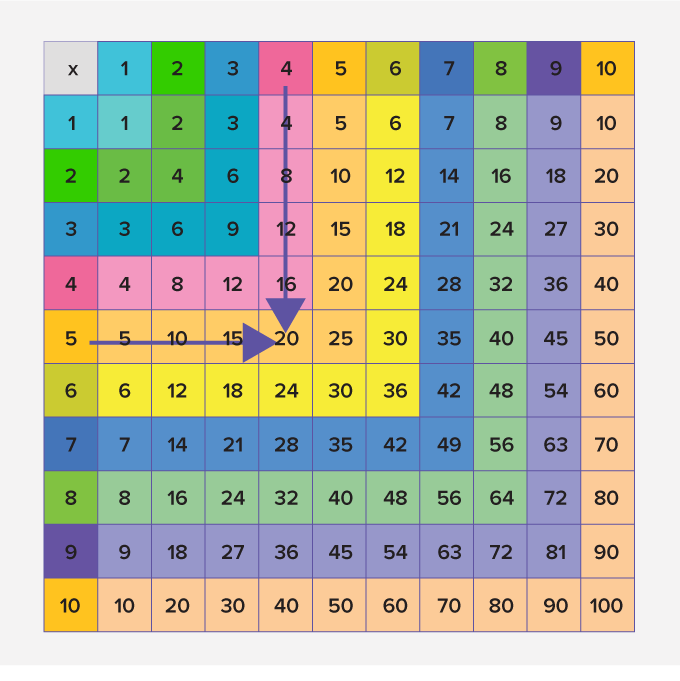
Thus, 5 × 4 = 20.
Recommended Worksheets
Understanding Multiplication Chart
A multiplication chart can be divided into two parts – lower times table, and upper times table. The multiplication tables of 1, 2, 5, and 10 are easier to remember as they follow a pattern.
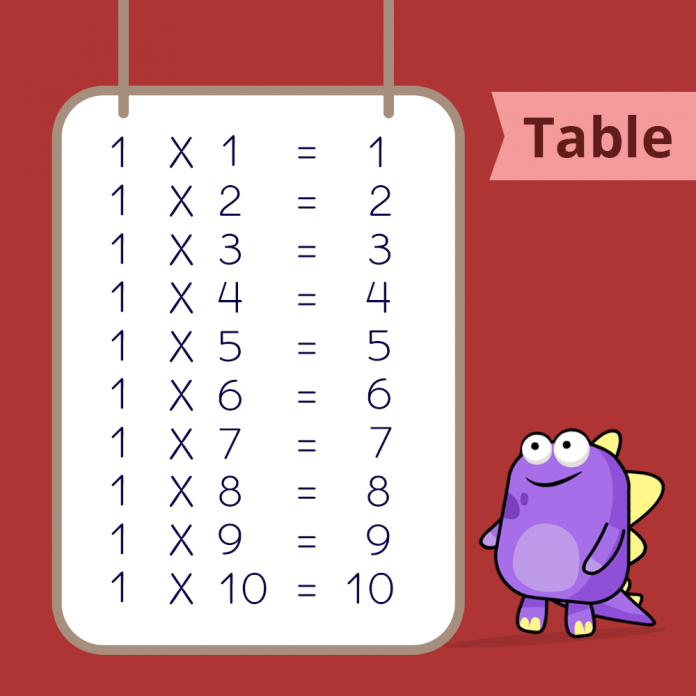
- The product of any number with 1 is the number itself.
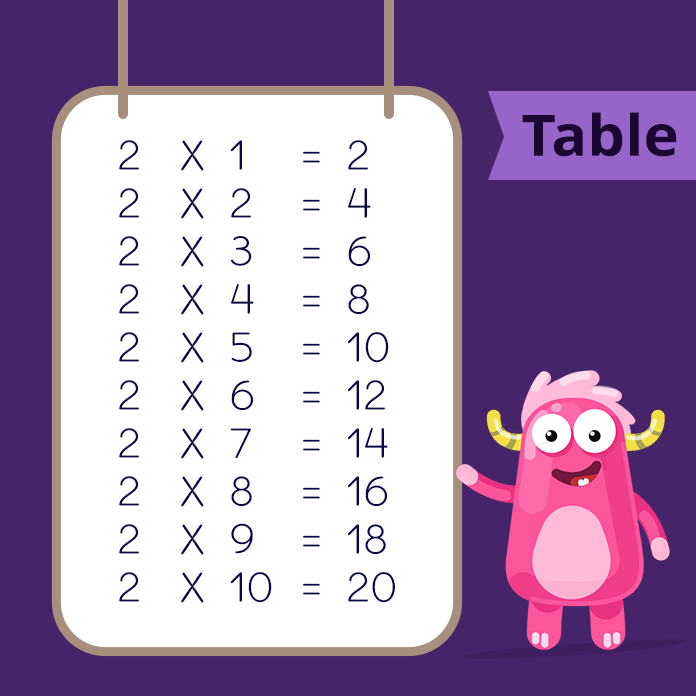
- The product of any number with 2 is double the number.
- The ones digits of the multiplication table of 5 alternates between 0 and 5.
- It is easy to remember the table of 10 because the digit at the ones place is always zero.
These parts of the multiplication chart which are easy to remember are called lower times tables. The rest of the table is called the upper times table.
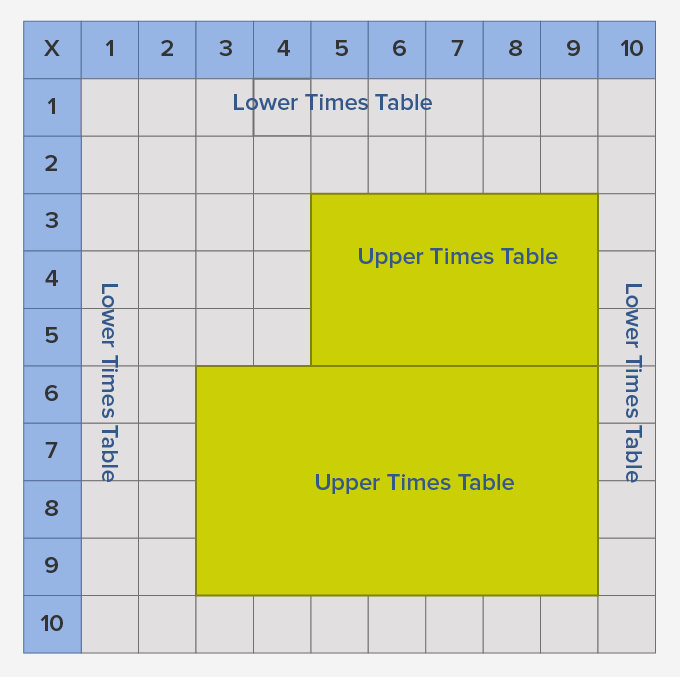
The upper times table also can be learned using repeated addition and practice.
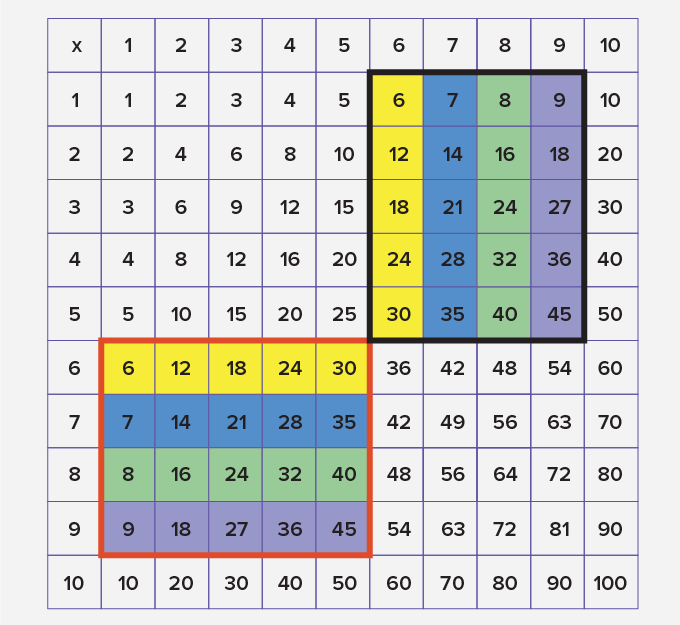
One important property of multiplication is that the order in which you multiply any two numbers does not affect the product.
So, in a multiplication chart, for any product, you can find the identical number with the numbers reversed in the statement.

Further, you can find many blocks as shown, which are identical but written in the transposed manner.
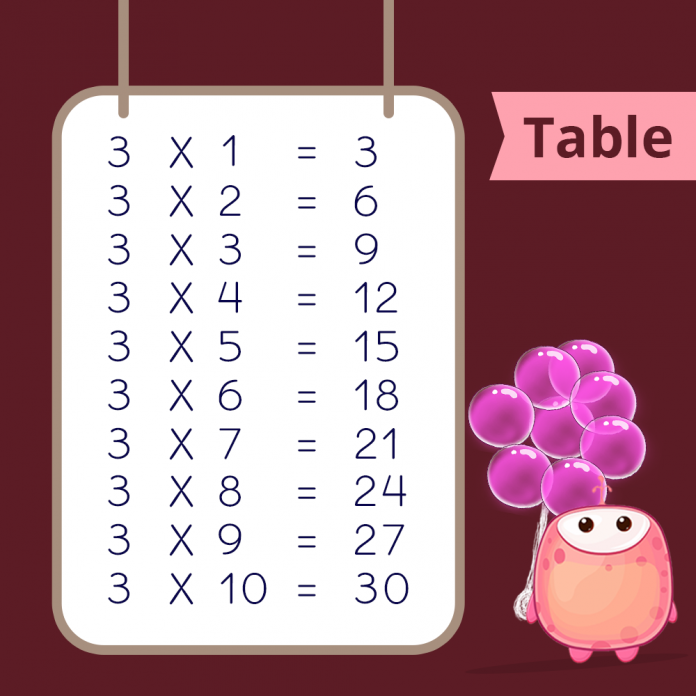
Times Tables 1 to 10 (Free Printables)
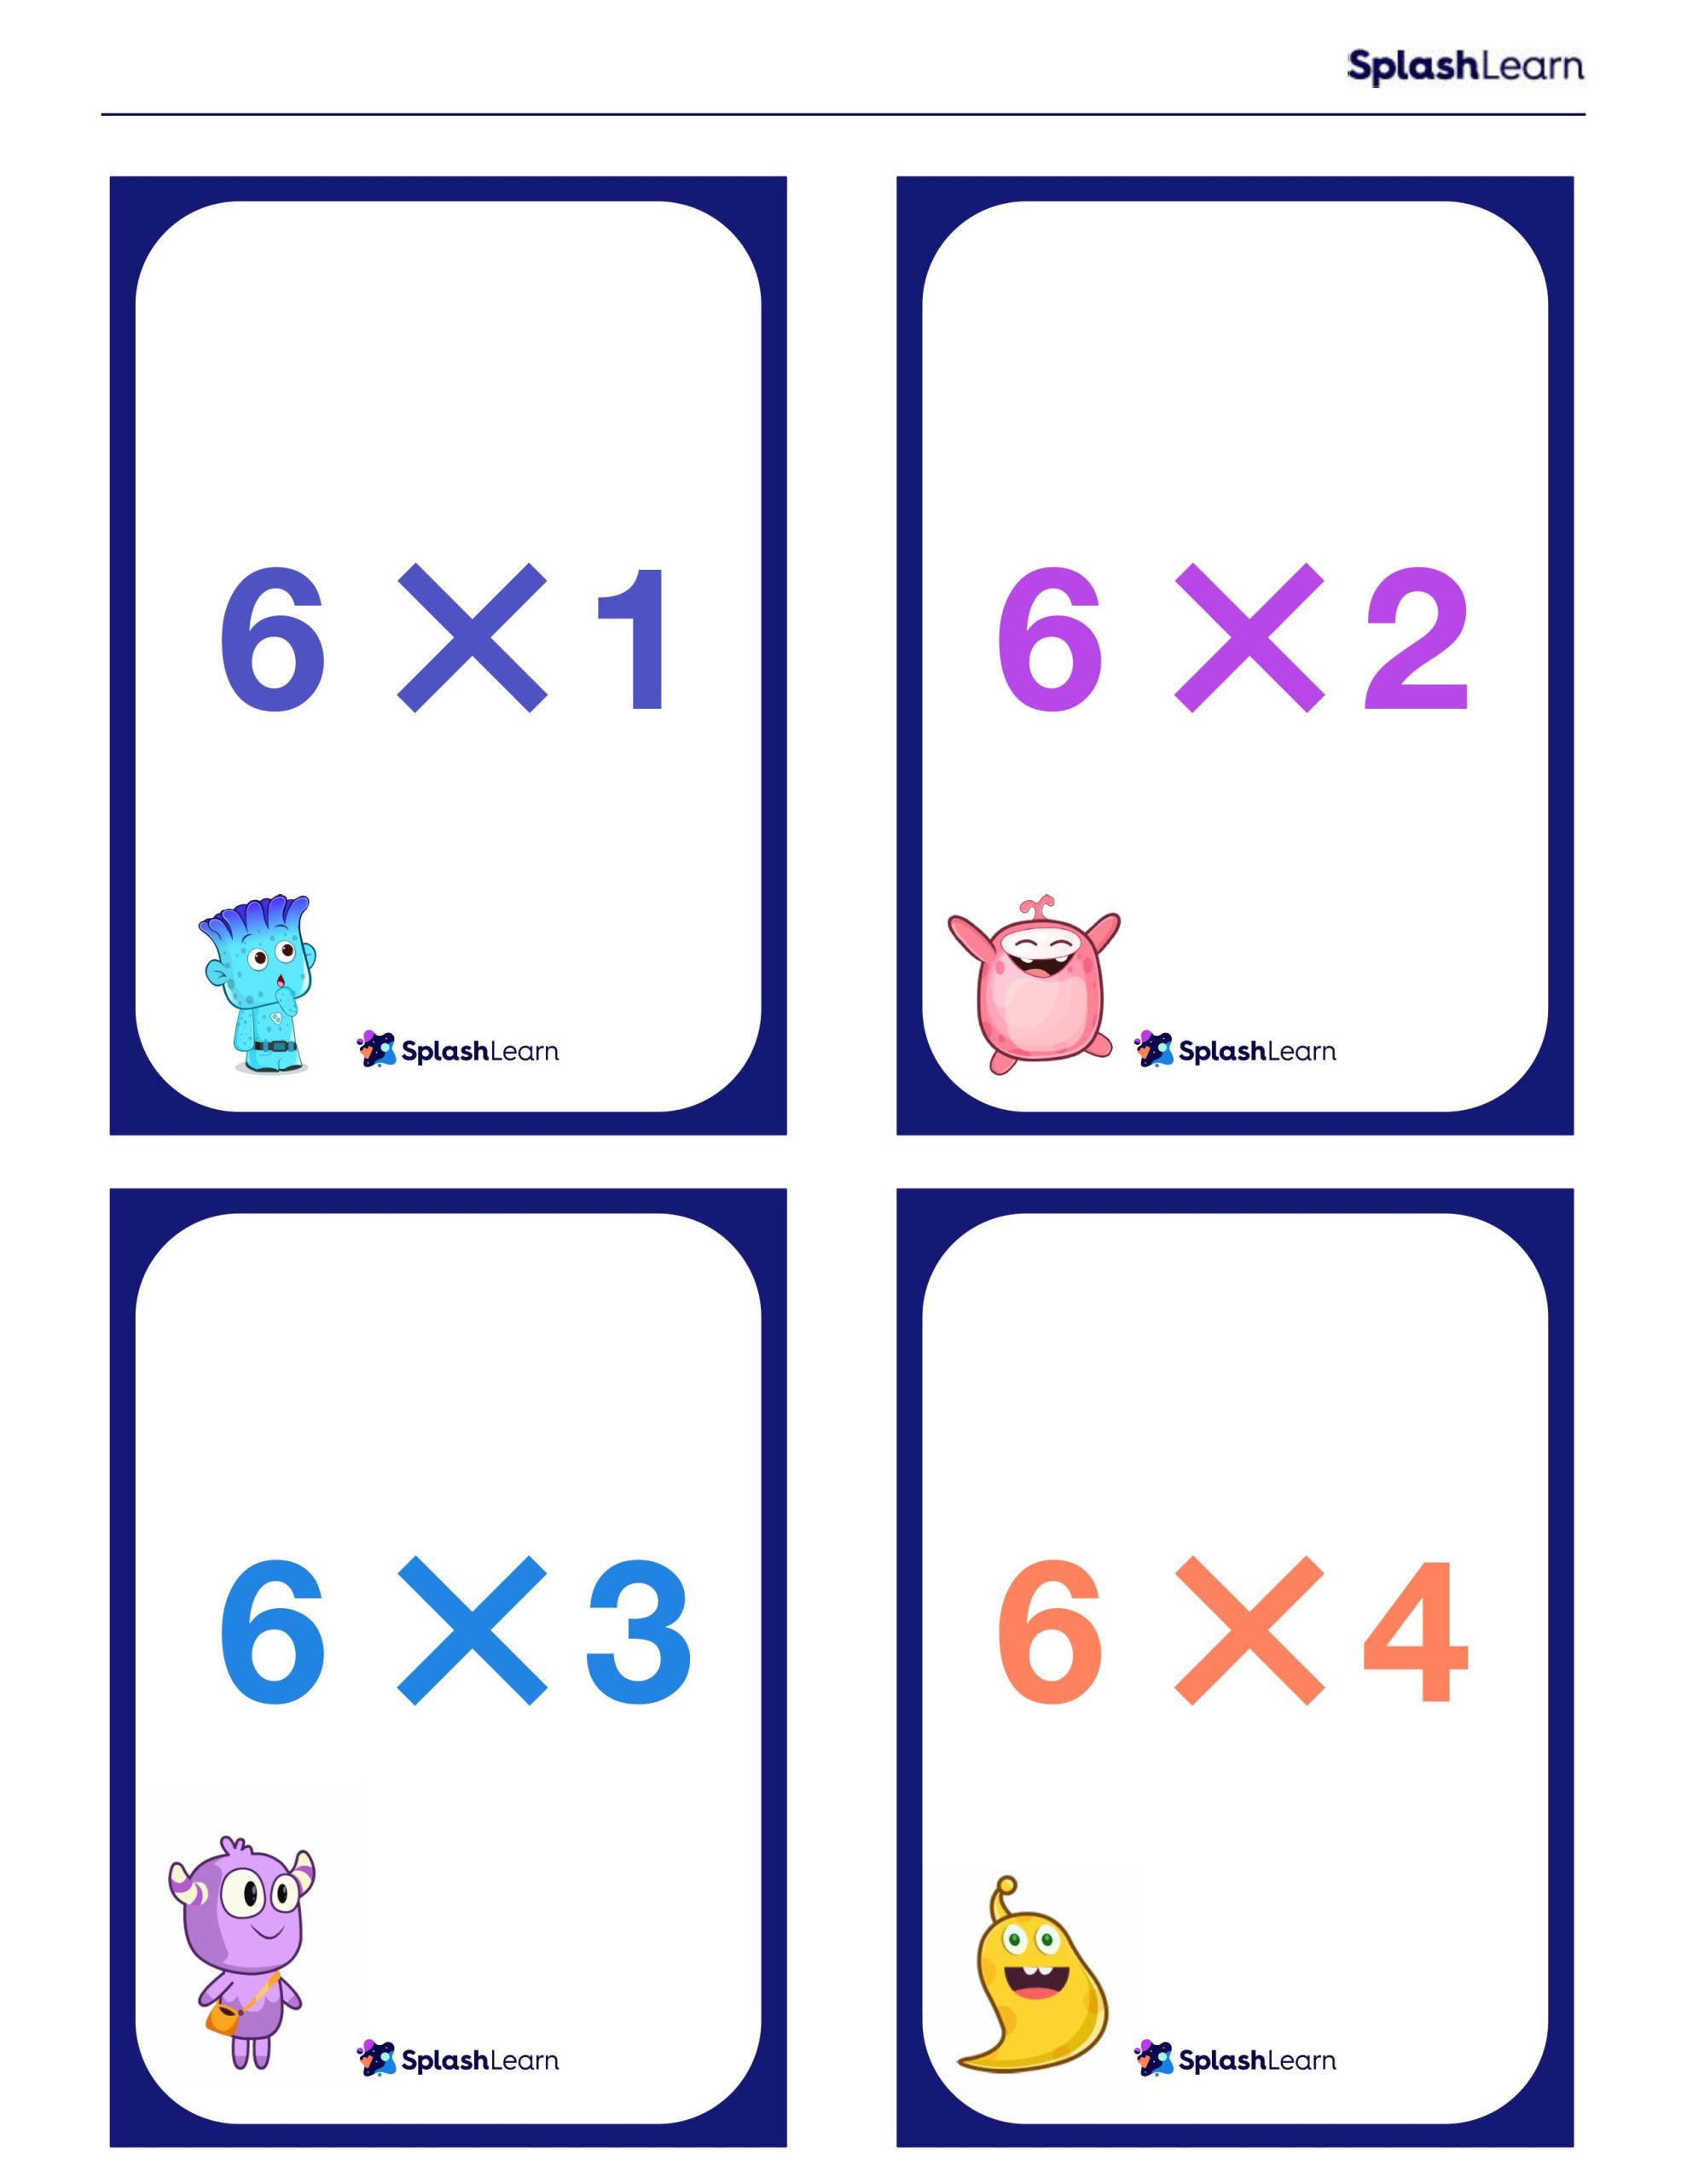
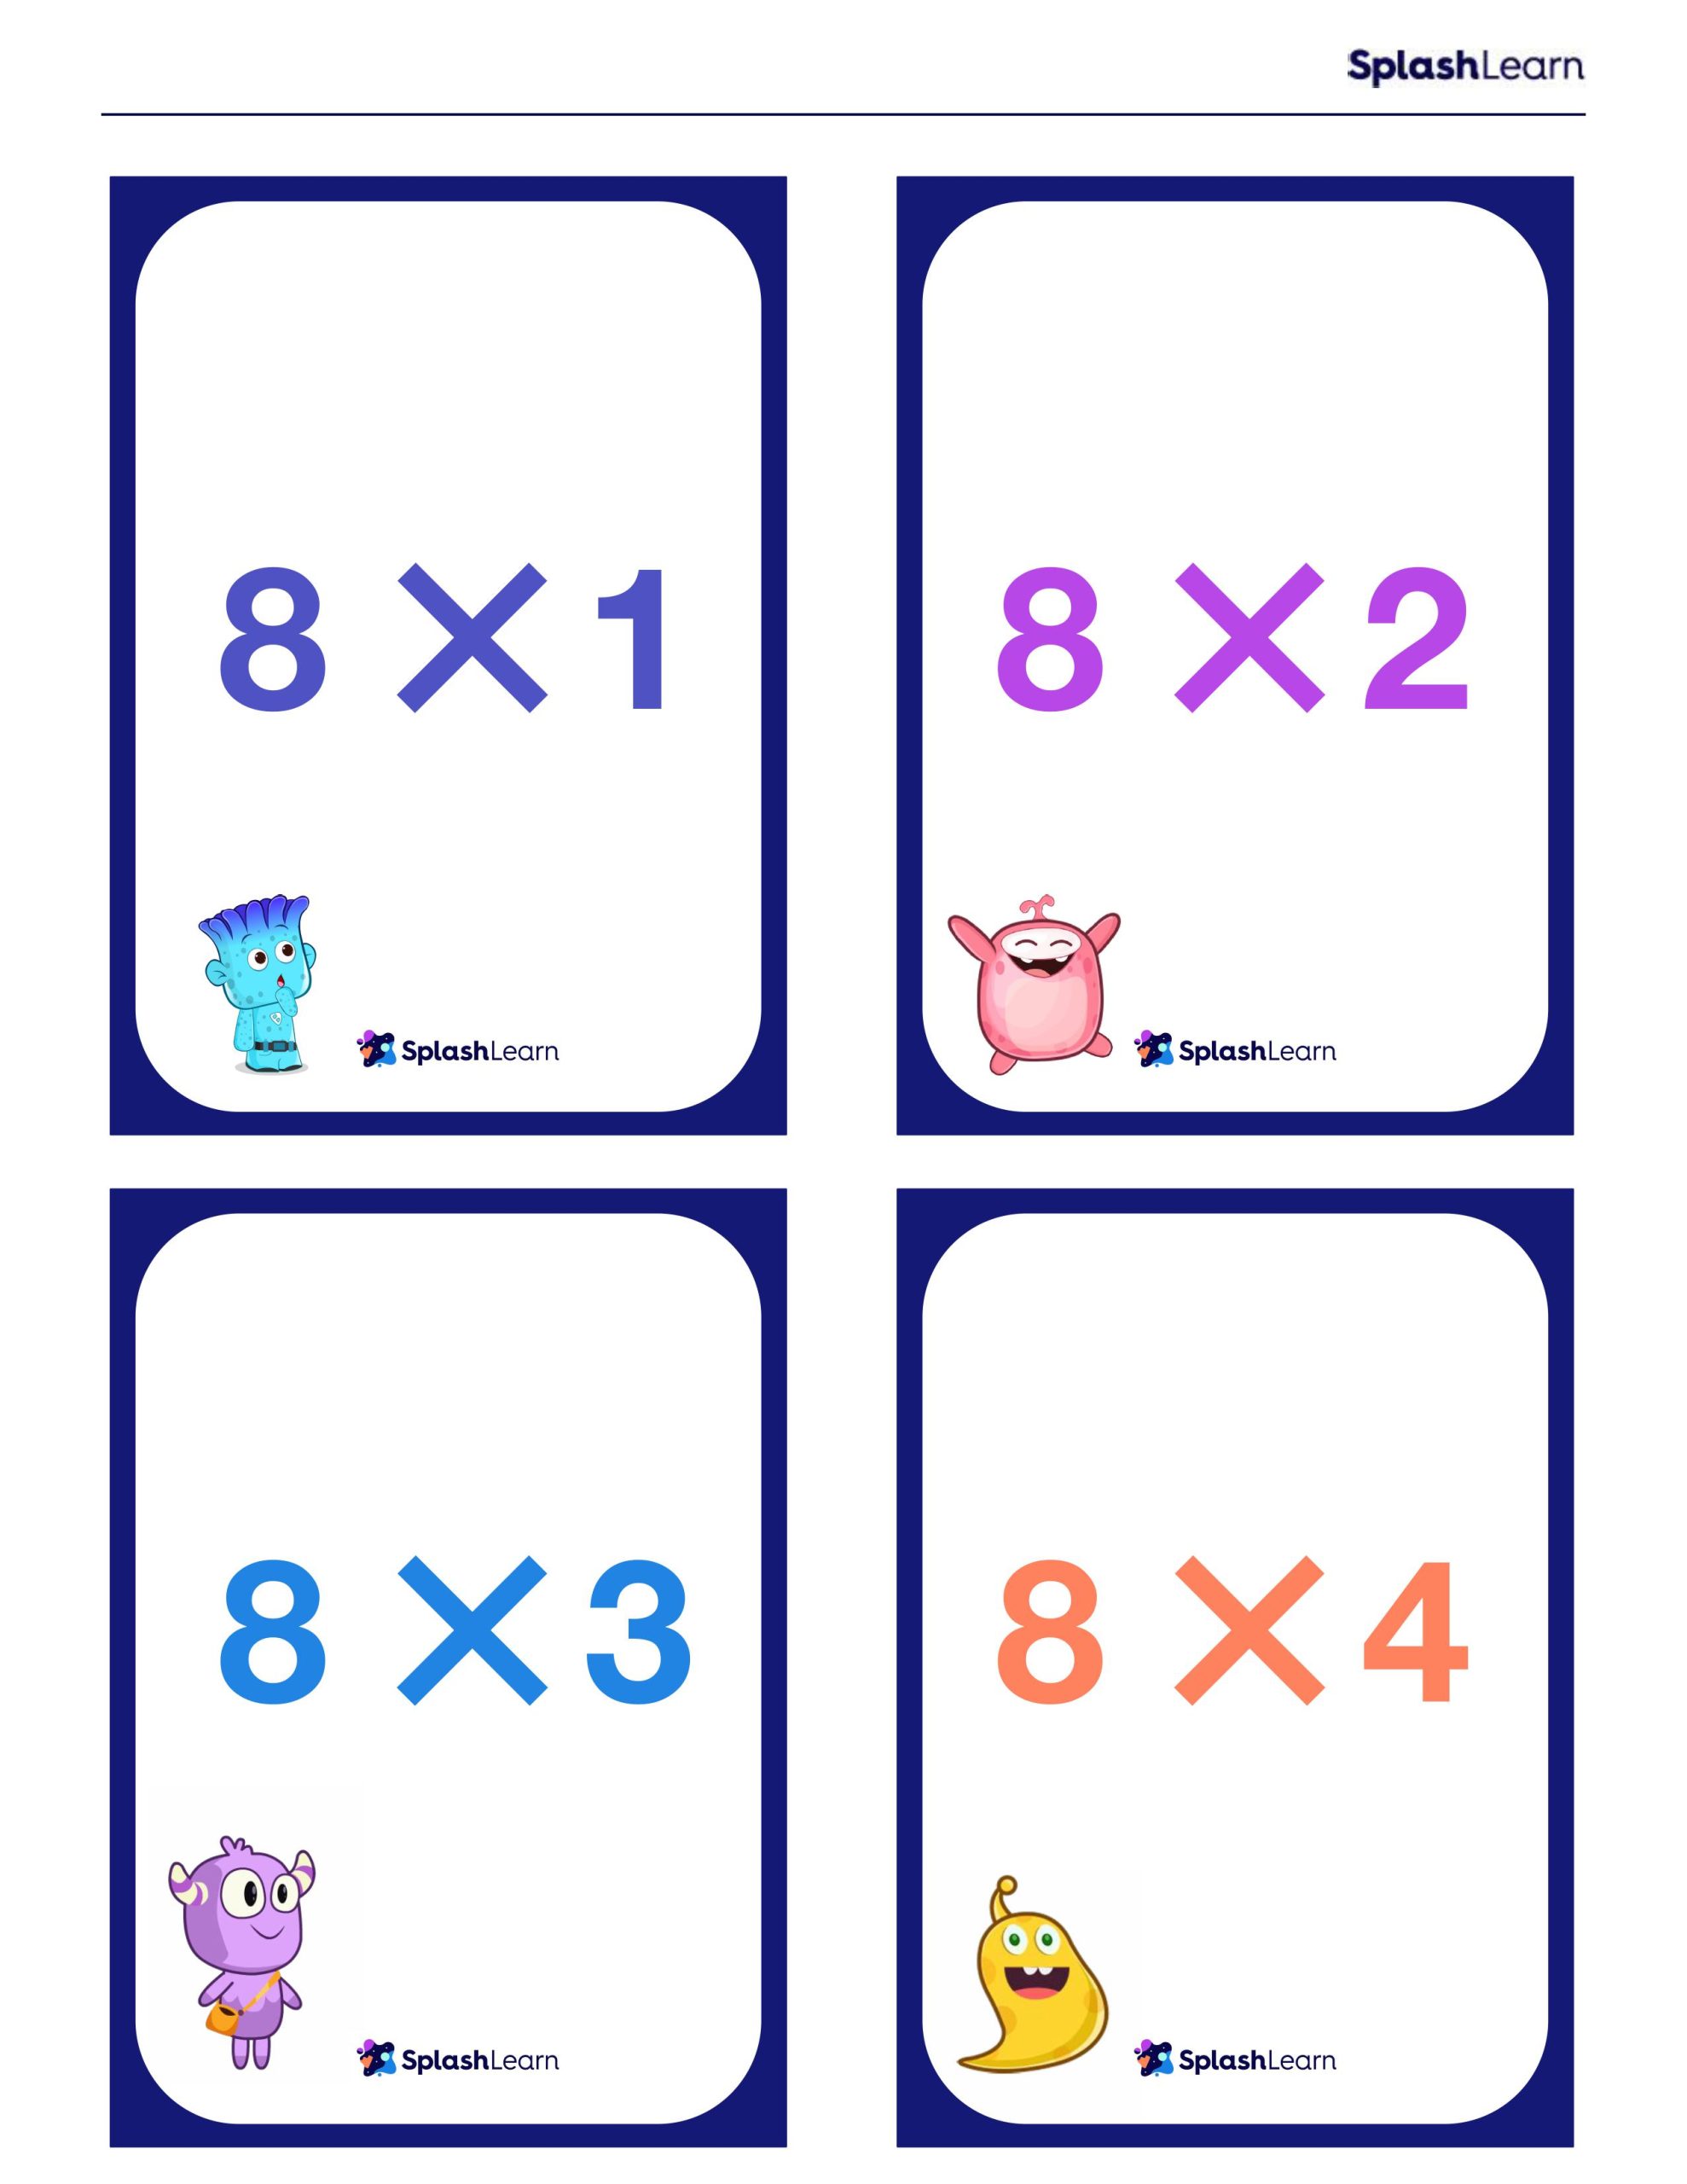
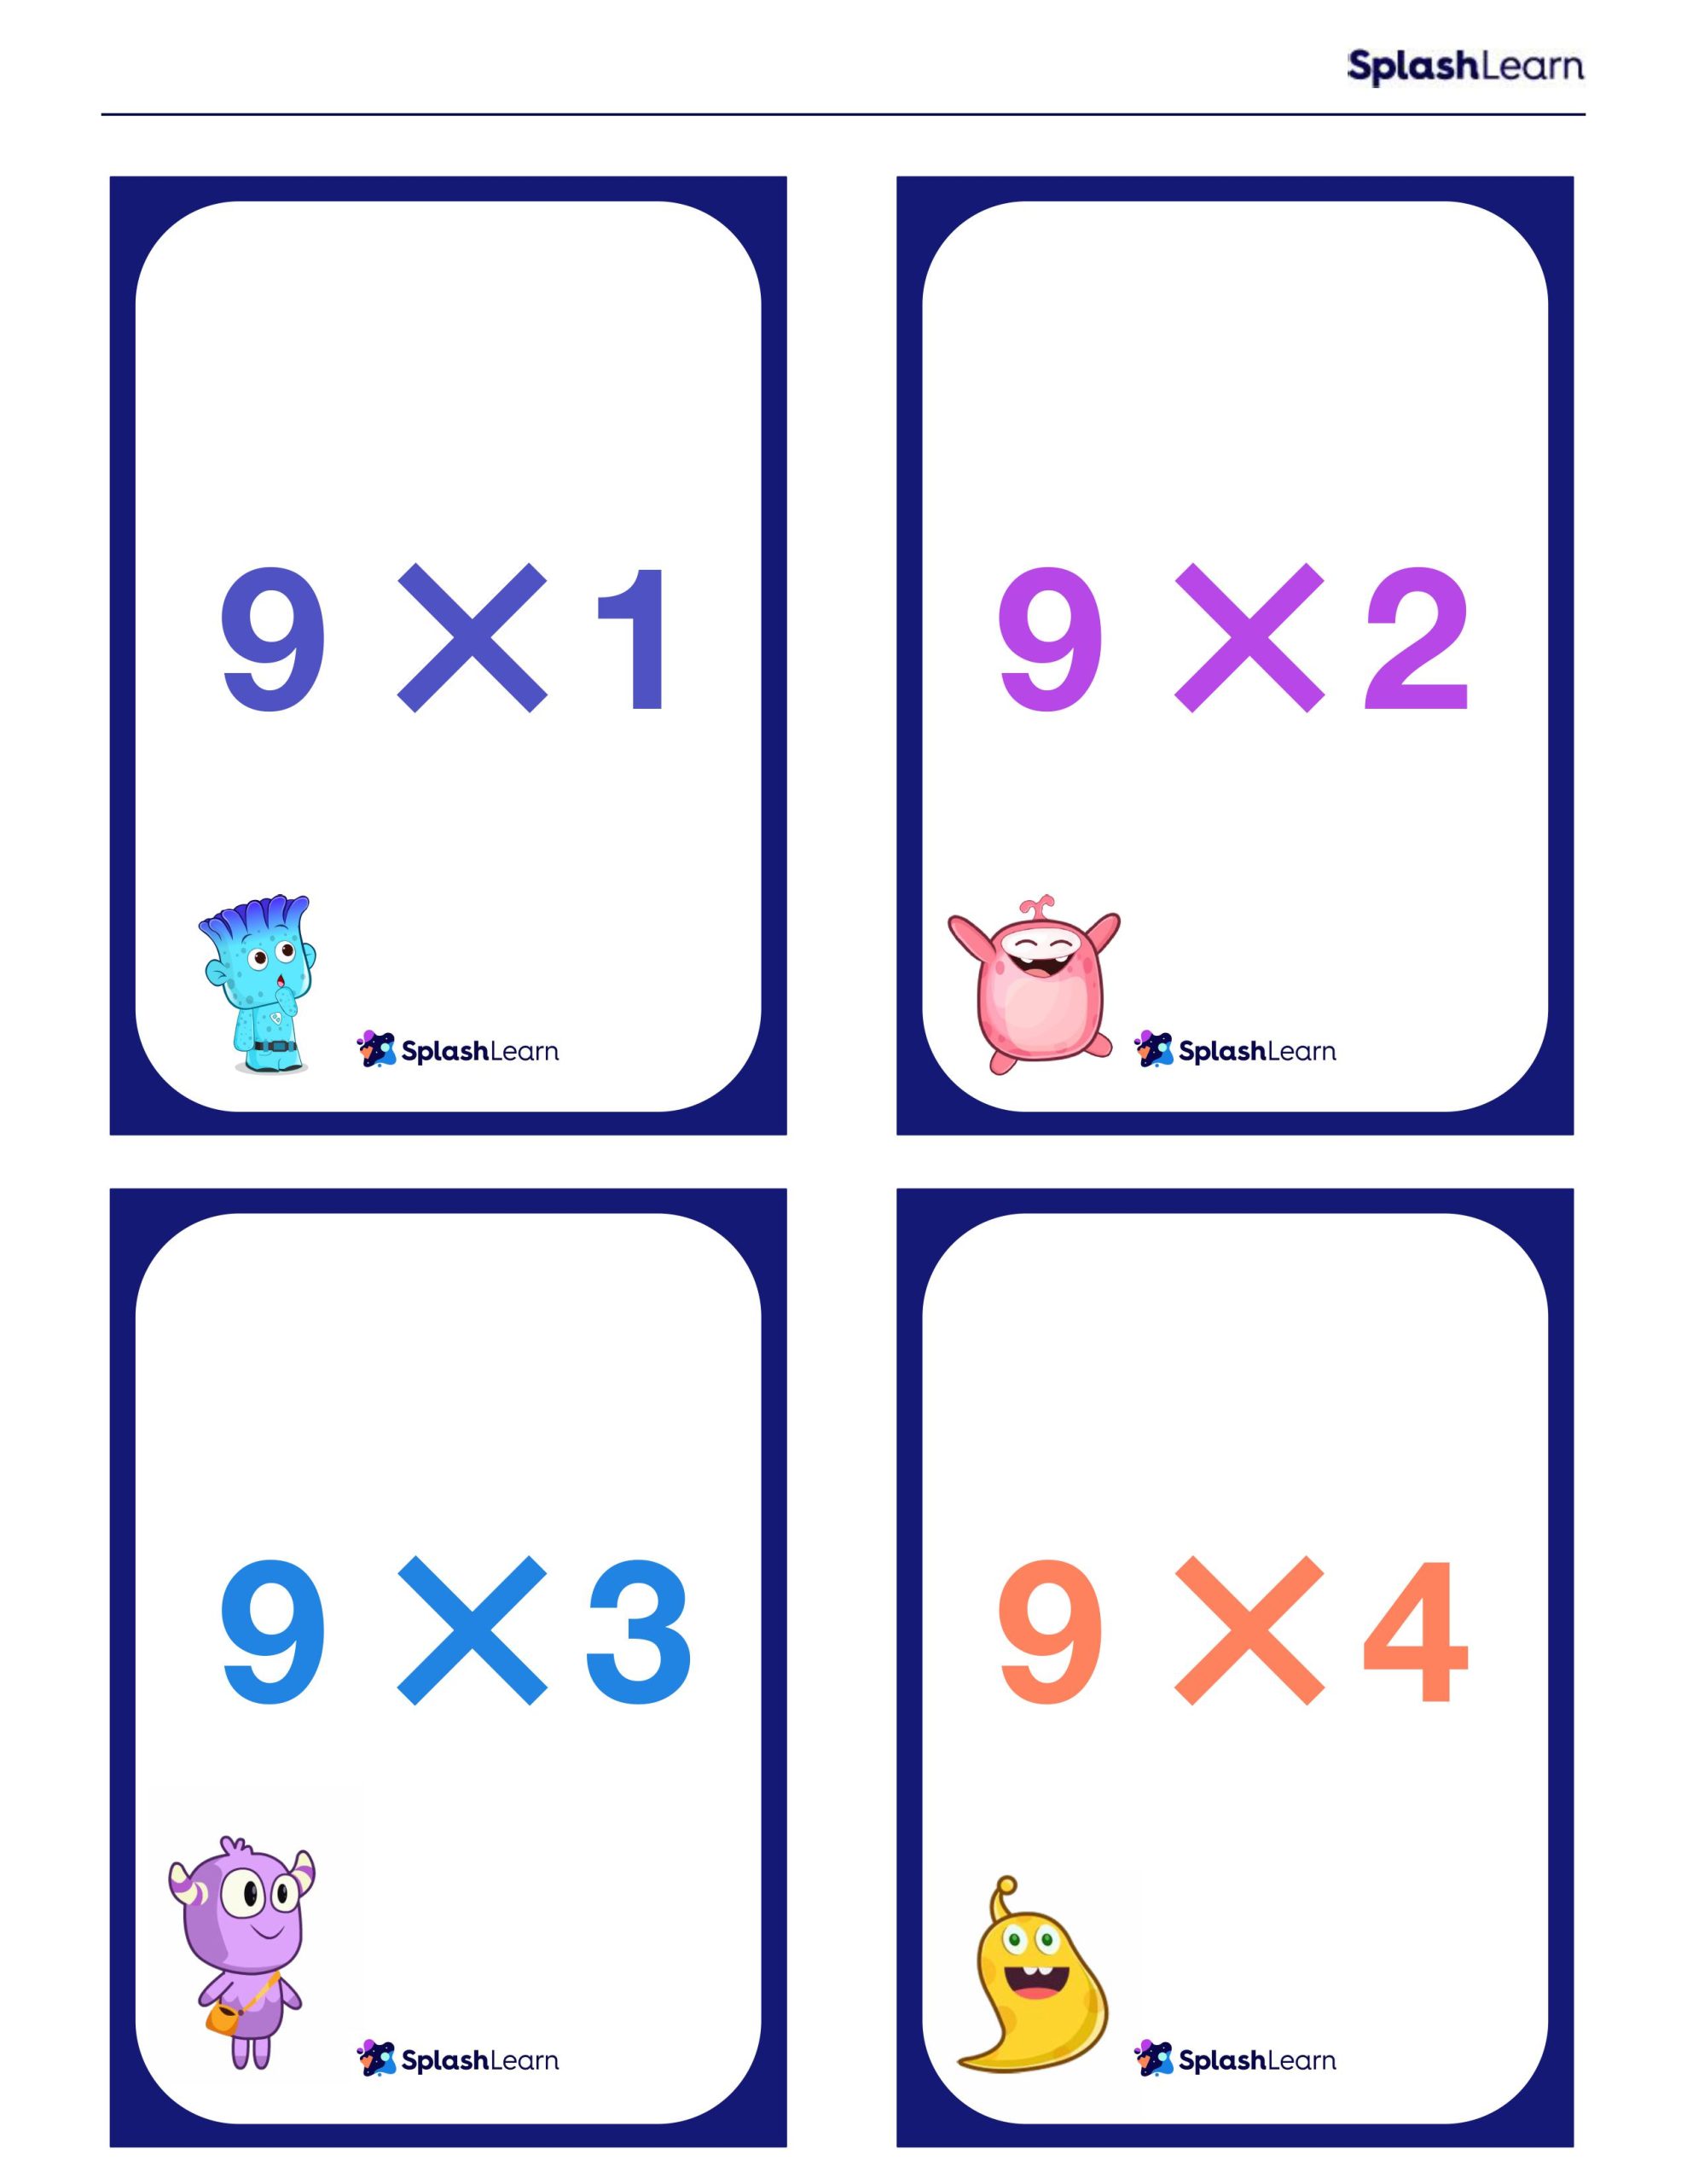
Multiplication Chart and Flash Cards (Free Printables)
Solved Examples
Example 1: How can you find 7 × 3 using a multiplication chart?
Solution:
To find 7 x 3, we must find the row that shows the 7 times tables and the column that shows the 3 times table. Then we look for the box where they overlap. They overlap at the number 21.
So, 7 x 3 = 21
Example 2: Verify on the multiplication chart if 2 × 8 and 8 × 2 give the same result.
Solution:
To find 2 × 8, first locate the row with all the multiples of 2. Next find the column with the multiples of 8. The box where they overlap will tell you the product of 2 and 8 that is 16.
To find 8 × 2, first locate the row with all the multiples of 8. Next find the column with the multiples of 2. The box where they overlap will tell you the product of 8 and 2 that is 16.
So, 2 × 8 and 8 × 2 give the same result.
Example 3: Kim has 4 bags of marbles. Each bag has 7 marbles in it. How many marbles are there in all? Use a multiplication chart to find the solution.
Solution:
1 bag has 7 marbles. So, 4 bags will have 4 times 7 marbles.
Using the multiplication chart, we find that Kim has 28 marbles.
Example 4: A basket has 8 mangoes in it. How many mangoes will there be in 5 such baskets? Use a multiplication chart to find the solution.
Solution:
1 basket has 8 mangoes. So, 5 baskets will have 5 times 8 marbles.
Using the multiplication chart, we will find that there will be 40 mangoes in 5 baskets.
Example 5: A cupboard has 4 shelves. How many shelves will be there in 6 such cupboards? Use a multiplication chart to find the solution.
Solution:
1 cupboard has 4 shelves. So, 6 cupboards will have 6 times 4 shelves.
Using the multiplication chart, we will find that there will be 24 shelves in 6 cupboards.
Example 6: Olivia plants 3 trees every year. How many trees will she plant in the next 9 years? Use a multiplication chart to find the solution.
Solution:
3 trees are planted in one year. So, in 9 years the number of trees planted will be 9 times 3.
Using the multiplication chart, we will find that 27 trees will be planted in 9 years.
Practice Problems
Multiplication Chart
Which one of the following is different?
8 × 4 = 32, because rest all other product equal to 30.
The figure below is a model for which multiplication sentence?

As there are 2 rows with 6 dots in each row. So, 2 times 6 is 12.
If 7 × 8 = 56, then what is 8 × 7?
Because multiplication is commutative. So, 7 × 8 = 56 then 8 × 7 = 56.
Emma is practicing her multiplication facts for 3. If she has counted to 21, how many 3s has she counted?
as 3 times 7 is 21.
Frequently Asked Questions
What are multiplication times tables?
A multiplication times table shows the results of multiplying two numbers.
When was the first multiplication chart created?
About 4,000 years ago
Why is it important to memorize multiplication tables?
Memorizing multiplication tables enables kids to perform complex mathematical calculations in higher grades with more confidence and fluency.
Where can multiplication tables be used in day to day life?
Multiplication is used in everyday life at various instances. For example, finding the total amount by counting the number of bills/coins of the same type, finding area, volume etc., calculating the price of multiple items given the price of 1 item and so on.
Does the order of numbers matter in multiplication?
No, the numbers can be multiplied in any order.


