An axis in mathematics is defined as a line that is used to make or mark measurements. The x and y-axis are two important lines of the coordinate plane. The x-axis is a horizontal number line and the y-axis is a vertical number line. These two axes intersect perpendicularly to form the coordinate plane. The x-axis is also called the abscissa and the y-axis is called the ordinate.
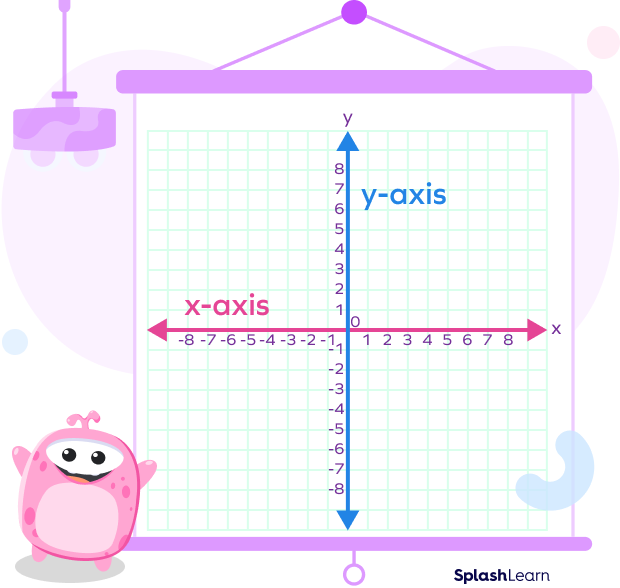
Any point on the coordinate plane can be located or represented using these two axes in the form of an ordered pair of the form (x,y). Here, x represents the location of the point with respect to the x-axis and y represents the location of the point with respect to the y-axis.
The origin is where the two axes intersect and is written as (0,0).
Plotting Points on X and Y Axis
Let us learn how to plot a point on the graph by using the X- and Y-axis.
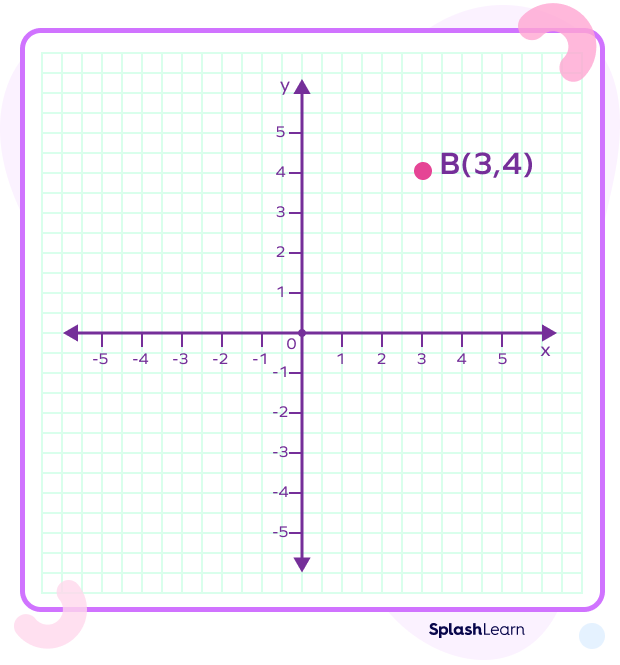
For example: Let’s try to plot the point B(3,4) on the graph.
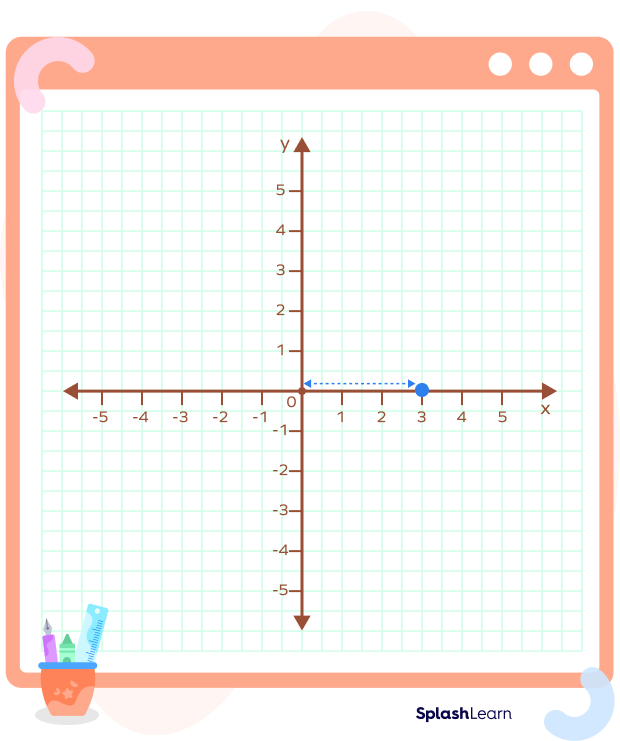
Here, the x-coordinate of B is 3. So we will start from the origin and move 3 units to the right on x-axis.
Now, the y-coordinate of B(3,4) is 4, so we will go 4 spaces up from this point.
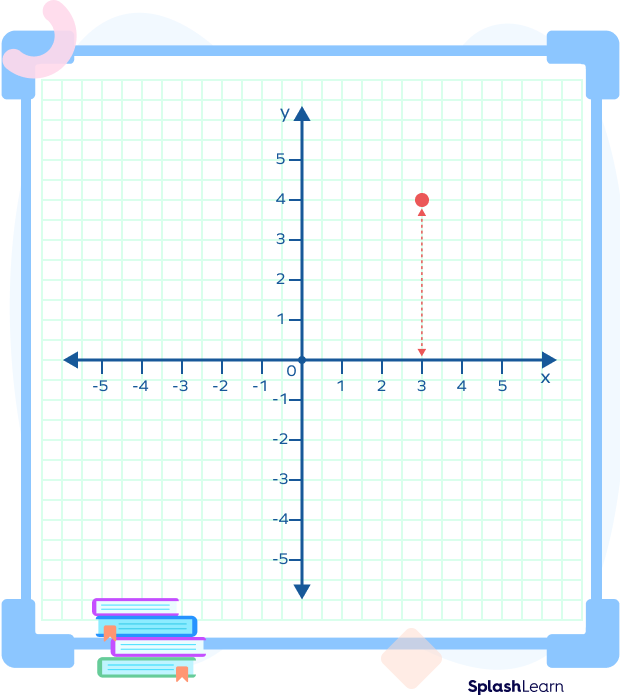
And thus we have plotted our point B(3,4) on the graph using the axes.
Recommended Games
Representing a Linear Equation on X- and Y-Axis
To understand how to represent a linear equation on the graph using the X- and Y-axis,
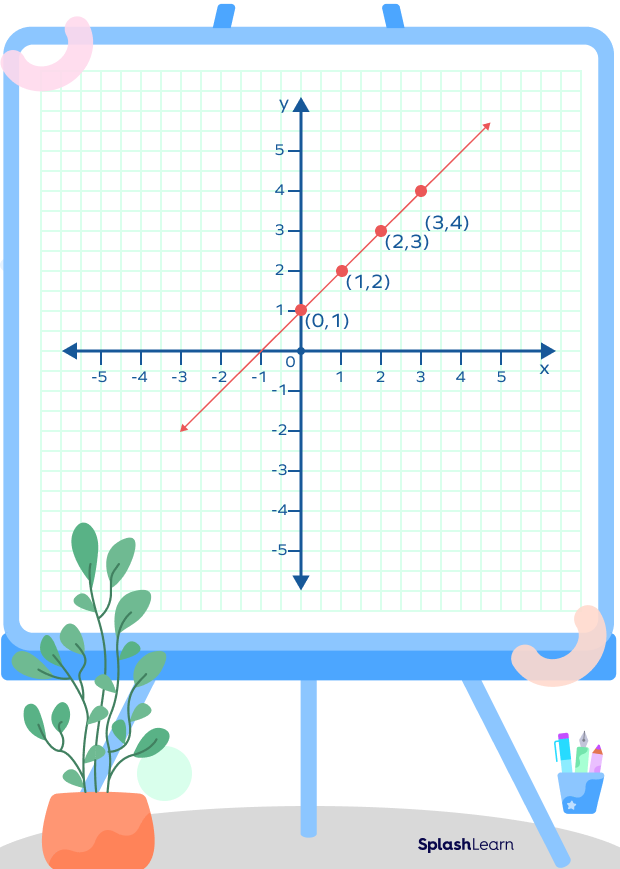
let us consider a linear equation, y = x + 1.
Now, let’s build a table to represent the corresponding values of y for different values of x and create their ordered pairs:
| x | y | Ordered pair |
| 0 | 1 | (0,1) |
| 1 | 2 | (1,2) |
| 2 | 3 | (2,3) |
| 3 | 4 | (3,4) |
The next step is to plot these ordered pairs on the coordinate plane graph.
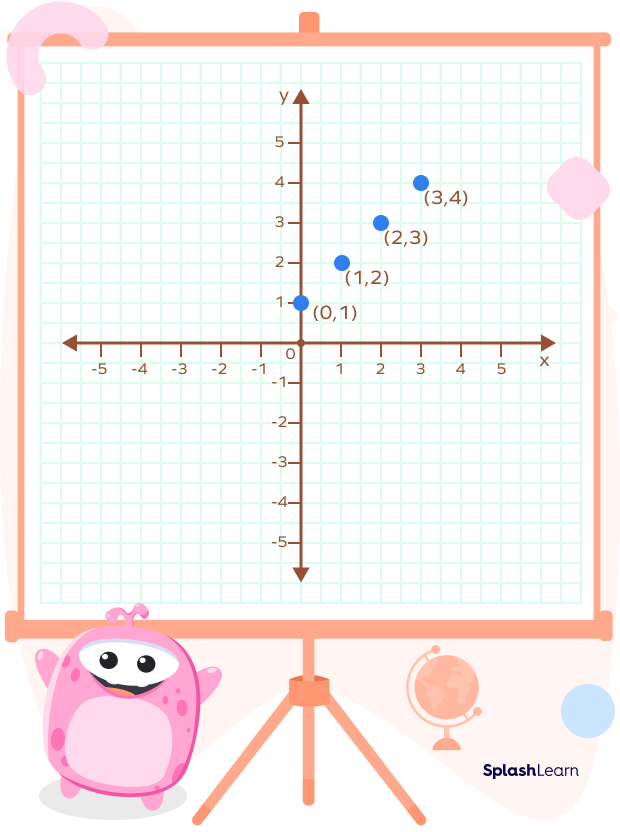
As a final step, we will join these points to form a straight line and that will be the representation of the equation y = x + 1.
Recommended Worksheets
Solved Questions On X and Y Axis
Question 1: Which of the following points lie on the x-axis?
(0, 1) (4, 0) (7, 7) (−5, 0) (−4, 4) (0, −5) (8, 0) (6, 0)
Answer: Since the coordinates lying on x-axis have their y coordinate zero (0), the following points will lie on x-axis:
(4, 0) (−5, 0) (8, 0) (6, 0)
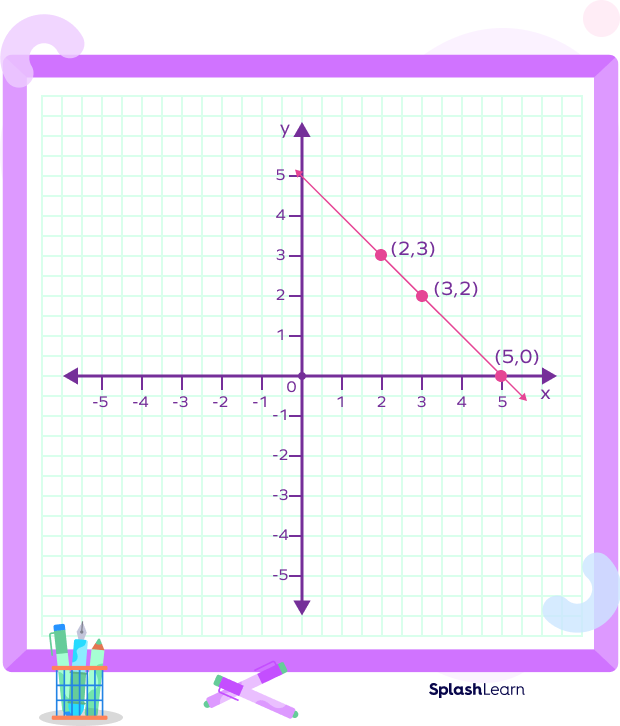
Question 2: Two different points are to be plotted on a graph. If the given points are (3,2) and (2,3), then plot these two points on the X- and Y-axis. Also, find out the point where the straight line going through these points meets the x-axis.
Answer: For (3,2), as we can see, the x-coordinate point is 3, and the y-coordinate point is 2.
Similarly we can plot the point (2,3).
Now, we can join both points with a straight line when we have plotted both points. After extending the straight line, we see that this line intersects the x-axis at point (5,0).
Question 3: For a linear equation y = 2x + 6, find the point where the straight line meets y-axis on the graph.
Answer: On y-axis, the x-coordinate of the point is 0. Therefore, we can find the intersection point of y-axis and y = 2x + 6 by simply putting the value of x as 0 and finding the value of y. y = 2(0)+6 = 0 + 6 = 6.
So the straight line of the equation y = 2x + 6 meets the y-axis at (0,6).
Practice Problems On X and Y Axis
X And Y Axis
What is the x-axis called?
x - axis is also called abscissa.
What is the correct way of representing a point on a graph?
(X-coordinate, Y-coordinate) is the correct way to represent a point.
How is the origin point represented on a graph?
(0, 0) is the coordinates of origin on the graph.
A point (0,5) will be lie on the
As abscissa (x- coordinate) is 0. So, given point lies on the y-axis.
Frequently Asked Questions On X and Y Axis
Why are the X- and Y-axis important?
The X- and Y-axis are essential for a graphical representation of data. These axes make the coordinate plane. The data is located in coordinates according to their distance from the X- and Y-axis. Graphical representation helps in solving complicated equations.
How is the coordinate plane formed?
A coordinate plane is a two-dimensional plane formed by the intersection of two number lines. One of these number lines is a horizontal number line called the x-axis and the other number line is a vertical number line called the y-axis (or ordinate). These two number lines intersect each other perpendicularly and form the coordinate plane.
What are quadrants in a graph?
The two number lines divide the coordinate plane into 4 regions. These regions are called quadrants. The quadrants are denoted by roman numerals and each of these quadrants have their own properties. X and Y have different signs in each quadrant.
- Quadrant I: (x,y)
- Quadrant II: (-x,y),
- Quadrant III: (-x,-y),
- Quadrant IV: (x,-y).
How are the X- and Y-axis different?
The X-axis gives the horizontal location of a point, and the Y-axis gives a vertical location of a point.


